

Image Details
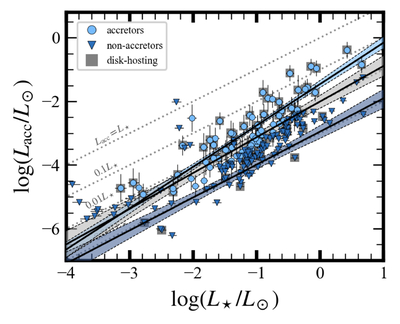
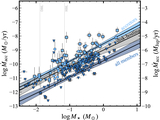
Caption: Figure 5.
Accretion luminosity versus stellar luminosity for the IC 348 sample. Accretors (detections) are shown as light blue circles and nonaccretors (upper limits) as dark blue triangles. Systems with primordial thick disks from C. J. Lada et al. (2006) are highlighted as gray squares. Dotted lines indicate constant Lacc/L⋆ = 1, 0.1, 0.01, and 0.001. The light blue band is the fit to the accretors only, the gray band to the disk-hosting systems, and the dark blue band to all members.
Other Images in This Article
Show More
Copyright and Terms & Conditions
© 2026. The Author(s). Published by the American Astronomical Society.

Copyright ©
2026 Astronomy Image Explorer. All Rights Reserved.
