

Image Details
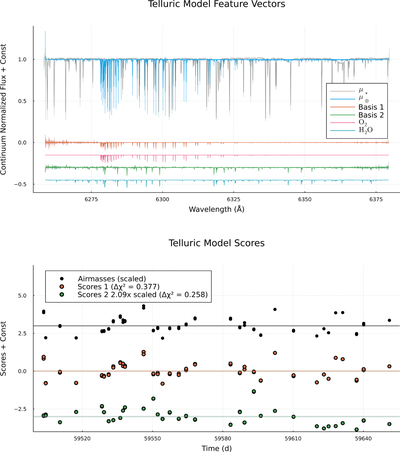
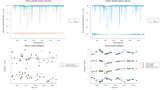
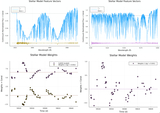
Caption: Figure 8.
SSOF model of order 97 for HD 26965, which separates the two dominant modes of telluric variability. Top: the telluric and stellar templates are shown above in gray and blue while the two telluric feature vectors are shown below in orange and green. For comparison, we also show portions of simulated H2O (turquoise) and O2 (pink) spectra. The simulated lines are those whose line depths are >0.1% in typical conditions at Kitt Peak. The line locations and emmissivities are from HITRAN2020 (R. Tolchenov et al. 2005; I. E. Gordon et al. 2011, 2022; S. Yu et al. 2014; T. Furtenbacher et al. 2020). The translucent portions of the feature vectors show the true values, while the solid portion is a version that has been smoothed by the instrumental LSF used during fitting. The orange feature vector captures the time variability of O2 lines while the green basis vector captures the time variability of H2O lines. Bottom: The telluric feature scores as a function of time (in modified Julian date, MJD). The scores for the O2 feature vector (orange) are highly correlated with observation air mass (black) while the scores for the H2O feature vector (green) are more erratic but clearly identified in multiple orders (see Figure 9). Δχ2 is one minus the ratio of the final model χ2 to the model χ2 if you set all of this feature’s scores to zero. Higher values mean the feature vector is more important and captures more variance. The residuals between v⋆,97 and ﹩{v}_{\star }^{{\mathtt{SSOF}}}﹩ are shown in Figure 11.
Other Images in This Article

Show More
Copyright and Terms & Conditions
© 2026. The Author(s). Published by the American Astronomical Society.

