

Image Details
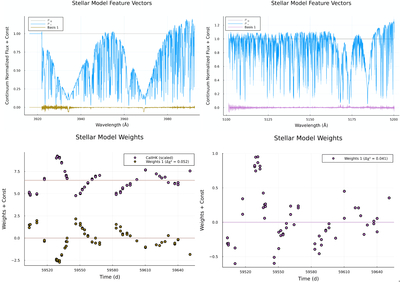
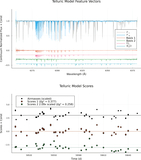
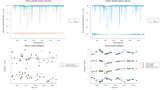
Caption: Figure 10.
SSOF models of order 155 for HD 26965 which identifies Ca II H&K variation and order 119 which identifies Mg triplet and MgH band variation. Top left: the telluric and stellar templates are shown above in gray and blue while the stellar feature vector is shown below (yellow). This vector is dominated by changing emission in the core of Ca II H&K, but also includes variations in other deep lines (including some Fe I lines; T. Ryabchikova et al. 2015) that are correlated with Ca II H&K changes. Bottom left: the stellar feature scores as a function of time. The scores for the Ca II H&K feature vector (yellow) are correlated with the Ca II H&K variation measured by NEID’s DRP (purple), although SSOF’s scores are a bit noisier due to the inclusion of the entire order. These scores show a quasiperiodic, decaying signal with a period of ∼40 days, consistent with previous measurements of HD 26965’s rotation rate. Top right: The telluric and stellar templates are shown above in gray and blue while the stellar feature vector is shown below (purple). This vector is dominated by changing depths in the Mg triplet and MgH bands. Bottom right: The stellar feature scores as a function of time. The scores for the Mg triplet and MgH band feature vector (purple) are also correlated with the Ca II H&K variation measured by both SSOF and NEID’s DRP. The residuals between each v⋆ and ﹩{v}_{\star }^{{\mathtt{SSOF}}}﹩ are shown in Figure 11.
Other Images in This Article

Show More
Copyright and Terms & Conditions
© 2026. The Author(s). Published by the American Astronomical Society.

