

Image Details
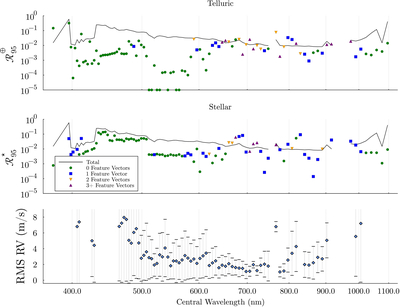
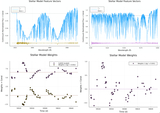
Caption: Figure 4.
Evaluation of SSOF performance on synthetic dataset for Barnard’s star. We compare each SSOF-reconstructed spectrum (solid line in top and middle panels), reconstructed telluric transmittance spectrum (points in top panel), and reconstructed stellar spectrum (points in middle panel) to the true values used to generate the input data. See the caption of Figure 3 for details. This figure demonstrates that SSOF is accurately estimating each individual component of the model—the stellar spectrum, the telluric spectrum, and the RV—for nearly all orders between 500 and 800 nm. The few exceptions are orders with very low SNR (<500 nm) or with saturated absorption lines (either stellar or telluric).
Other Images in This Article

Show More
Copyright and Terms & Conditions
© 2026. The Author(s). Published by the American Astronomical Society.

