

Image Details
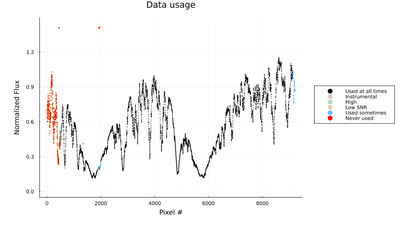
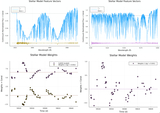
Caption: Figure 6.
An example of a time-averaged spectrum for an order of NEID data (which includes Ca II H&K ) showing which parts of the spectrum are being used by SSOF after data preprocessing. Different parts of the spectrum are masked for various reasons. The bluer side of this order (order 155 in Table 2) had low SNR (yellow border). Some pixels were masked by the instrumental pipeline (orange border) or had anomalously high observations (green border). Pixels which are never used (red) are surrounded by pixels that are sometimes used (blue). The blue pixels are sometimes ignored when fine-tuning S⊕, S⋆, and v⋆.
Other Images in This Article

Show More
Copyright and Terms & Conditions
© 2026. The Author(s). Published by the American Astronomical Society.

