

Image Details
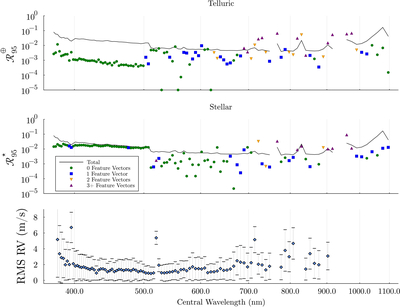
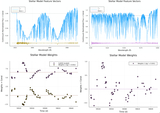
Caption: Figure 3.
Evaluation of SSOF performance on synthetic dataset for HD 26965. We compare each SSOF-reconstructed spectrum (solid line in top and middle panels), reconstructed telluric transmittance spectrum (points in top panel), and reconstructed stellar spectrum (points in middle panel) to the true values used to generate the input data. Each point corresponds to results for one order (that is analyzed independently of other orders). The x-axis value indicates the typical central wavelength for that order. ﹩{{ \mathcal R }}_{95}^{\oplus }﹩ (﹩{{ \mathcal R }}_{95}^{\star }﹩) indicates the median (over 100 observations) of the 95th quantile (over pixel columns 1500–7500) of the residuals between the input telluric (or stellar) input spectrum and reconstructed telluric (or stellar) spectrum, after both have been convolved with a shared LSF. For comparison, the solid line shows ﹩{{ \mathcal R }}_{95}^{{\rm{obs}}}﹩, the median of the 95th quantile of the residuals between the input spectrum (before adding photon noise) and reconstructed spectrum, again after both have been convolved with a shared LSF. The point color/style indicates the number of feature vectors used to generate the input data (based on results from analyzing actual observations). The lower panel indicates the rms deviation (over 100 observations) of the residuals for estimated radial velocities minus the true injected velocities (Earth’s motion with no additional planet). The RV uncertainty is estimated based on the curvature of the loss function. The errorbars show the median (over all observations) of the curvature-based errorbars (see Section 2.6). For orders at the blue and red edges plus a few orders in the red portion of the spectrum, the rms RV exceeds 8 m s−1 and is not shown. This figure demonstrates that SSOF is accurately estimating each individual component of the model— the stellar spectrum, the telluric spectrum, and the RV— for nearly all orders with acceptable SNR. The few exceptions are orders with saturated lines (either stellar or telluric), resulting in the SSOF model breaking down and SSOF trying to use more than two feature vectors for at least one component of the model.
Other Images in This Article

Show More
Copyright and Terms & Conditions
© 2026. The Author(s). Published by the American Astronomical Society.

