

Image Details
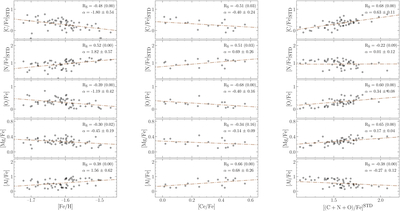
Caption: Figure 8.
Left column: from top to bottom, [C/Fe]STD, [N/Fe]STD, [O/Fe], [Mg/Fe], and [Al/Fe] vs. [Fe/H] of anomalous stars. The brown dotted–dashed line in each plot indicates the best-fit straight line. Central and right columns: the same as left column but with [Ce/Fe] and [(C+N+O)/Fe]STD instead of [Fe/H], respectively. In each plot, we report the Spearman correlation coefficient (with the corresponding p-value between parentheses) and the slope of the best-fit line with its associated uncertainty.
Other Images in This Article
Show More
Copyright and Terms & Conditions
© 2026. The Author(s). Published by the American Astronomical Society.

Copyright ©
2026 Astronomy Image Explorer. All Rights Reserved.
