

Image Details
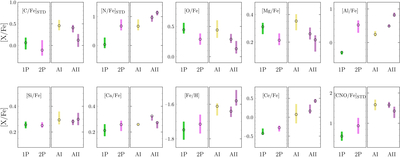
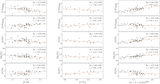
Caption: Figure 7.
Median abundances of 10 ratios (reported in the dedicated plot). Each diagram is divided into two panels, relative to 1P and 2P (left) and AI, AIIa, and AIIb (right) stars. x-axis coordinates are shifted arbitrarily for visualization purposes. Measurements are associated with a vertical bar representing their interquartile ranges, color-coded as in Figure 3.
Other Images in This Article
Show More
Copyright and Terms & Conditions
© 2026. The Author(s). Published by the American Astronomical Society.

Copyright ©
2026 Astronomy Image Explorer. All Rights Reserved.
