

Image Details
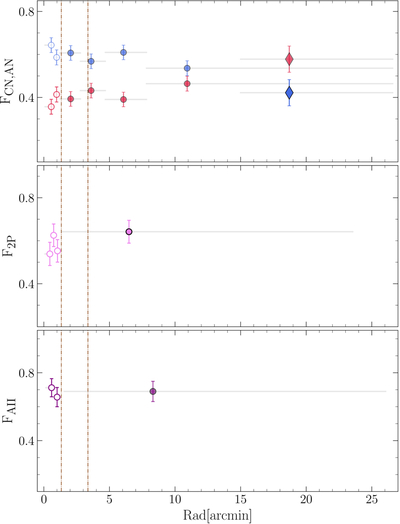
Caption: Figure 6.
Fraction of canonical and anomalous stars (top) in red and blue, respectively, of 2P stars compared to canonical (middle), and AII with respect to the whole anomalous stars (bottom). Empty dots indicate measurements from HST photometry, while filled dots represent measurement with VST+Gaia (for the bulk of canonical and anomalous) or APOGEE (for the subpopulations). Brown dashed lines indicate the core and half-mass radii from W. E. Harris (1996a, 2010 edition). Each measurement is associated to a horizontal gray line, indicating the reference radial range.
Other Images in This Article
Show More
Copyright and Terms & Conditions
© 2026. The Author(s). Published by the American Astronomical Society.

Copyright ©
2026 Astronomy Image Explorer. All Rights Reserved.
