

Image Details
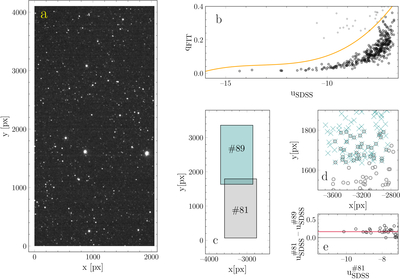
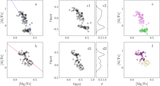
Caption: Figure 1.
Panel (a): chip #79 reduced OmegaCAM image of M22. Panel (b): qFIT vs. uSDSS of sources measured in chip#79, with the orange lines separating the stellar (black) from the excluded (gray). Panel (c): chip #81 and #89 footprints, colored in gray and teal, respectively. Panel (d): zoomed-in view of their coordinates (gray dots and teal crosses) in the overlapping area. Panel (e): chip #81 and #89 magnitude difference against uSDSS of chip #81. Gray and red lines indicate the zero-difference and the observed offset, respectively.
Other Images in This Article
Show More
Copyright and Terms & Conditions
© 2026. The Author(s). Published by the American Astronomical Society.

Copyright ©
2026 Astronomy Image Explorer. All Rights Reserved.
