

Image Details
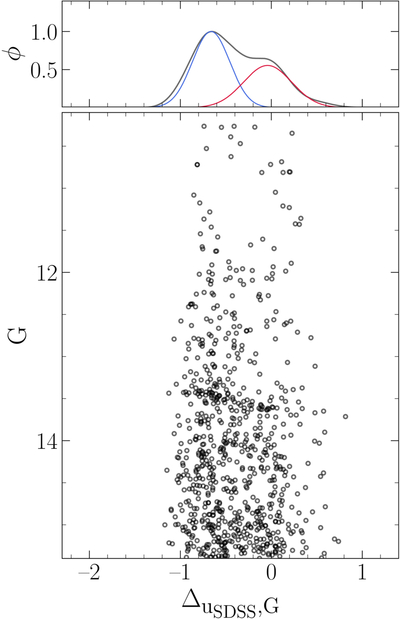
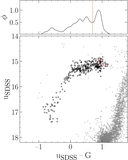
Caption: Figure 4.
G vs. the verticalized color ﹩{{\rm{\Delta }}}_{{{\rm{u}}}_{{\rm{SDSS}}},G}﹩ of RGB stars (bottom), with its kernel density distribution (top) indicated with a black line. The best-fit Gaussians representing the canonical and anomalous populations are indicated in blue and red, respectively.
Other Images in This Article
Show More
Copyright and Terms & Conditions
© 2026. The Author(s). Published by the American Astronomical Society.

Copyright ©
2026 Astronomy Image Explorer. All Rights Reserved.
