

Image Details
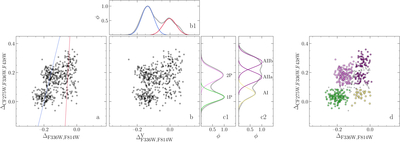
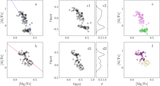
Caption: Figure 3.
Panel (a): ΔCF275W,F336W,F438W vs. ΔF336W,F814W ChM of RGB stars in M22. Blue and red lines indicate best-fit lines for bona fide canonical and anomalous stars, respectively. Panel (b): normalized ΔCF275W,F336W,F438W vs. ﹩{{\rm{\Delta }}}_{{\rm{F336W}},{\rm{F814W}}}^{{\rm{V}}}﹩ ChM (see the text for details). Panel (b1): kernel density distribution of ﹩{{\rm{\Delta }}}_{{\rm{F336W}},{\rm{F814W}}}^{{\rm{V}}}﹩ (gray) line, overlapped with the two Gaussian components obtained through GMM, indicating canonical (in blue) and anomalous (in red) stars. Panel (c1): kernel density distribution of ΔCF275W,F336W,F438W for the canonical stars only, with the Gaussian components relative to 1P and 2P colored in green and violet, respectively. Panel (c2): same as panel (c1) but for anomalous stars, where the AI and the AII (AIIa and AIIb) Gaussian distributions are colored in khaki and purple, respectively. Panel (d):ΔCF275W,F336W,F438W vs. ΔF336W,F814W, as in panel (a) but with stars with >80% probability of belonging to 1P, 2P, AI, and AII groups colored in green, violet, khaki, and purple, respectively.
Other Images in This Article
Show More
Copyright and Terms & Conditions
© 2026. The Author(s). Published by the American Astronomical Society.

