

Image Details
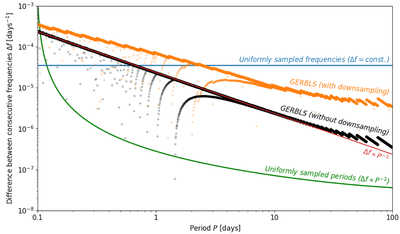
Caption: Figure 2.
The period sampling of GERBLS. The blue line represents uniformly sampled orbital frequencies (frequency differential Δf = const.), whereas the green line shows a sampling that is uniform in orbital period (Δf ∝ P−2). GERBLS (solid black dots) natively produces a sampling that is broadly a combination of the two, with the frequency differential approximated by Δf ∝ P−1 (red line). Smaller jumps between frequencies occur when moving from one folding transform to the next (with a base period larger by 1). When automatic downsampling is switched on (orange dots), the frequency differential can be well approximated as Δf ∝ P−0.72, which is close to the optimal search resolution of Δf ∝ P−2/3 for planets on circular orbits as demonstrated by A. Ofir (2014).
Other Images in This Article
Copyright and Terms & Conditions
© 2026. The Author(s). Published by the American Astronomical Society.

