

Image Details
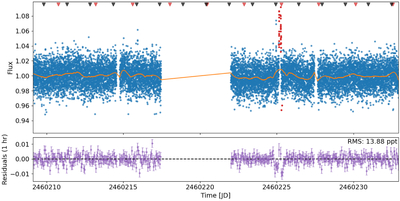
Caption: Figure 8.
Top: TESS PDCSAP light curve for TRAPPIST-1 from Observation Sector 70. The blue points represent valid data, while the red points were masked out during detrending. The orange line shows the fitted long-term flux baseline that was generated using an SG filter. The black and red triangle markers near the top denote the locations of transits of TRAPPIST-1 b and c, respectively, based on the limb-darkened transit models shown in Figure 10. Bottom: Flux residuals after dividing out the long-term flux baseline, binned to a 1 hr cadence. The rms of the unbinned residuals is 13.88 parts-per-thousand.
Other Images in This Article
Copyright and Terms & Conditions
© 2026. The Author(s). Published by the American Astronomical Society.

Copyright ©
2026 Astronomy Image Explorer. All Rights Reserved.
