

Image Details
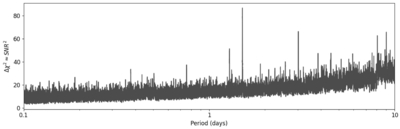
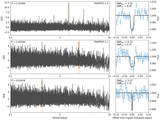
Caption: Figure 9.
The BLS spectrum generated from TRAPPIST-1 data in Figure 8. Note the general increase in the local mean and scatter of Δχ2 values toward longer orbital periods.
Other Images in This Article
Copyright and Terms & Conditions
© 2026. The Author(s). Published by the American Astronomical Society.

Copyright ©
2026 Astronomy Image Explorer. All Rights Reserved.
