

Image Details
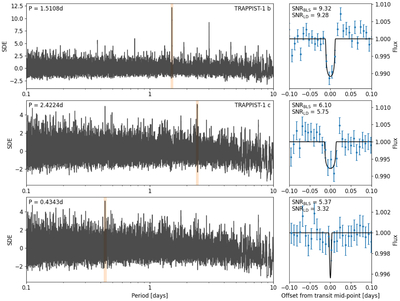
Caption: Figure 10.
GERBLS transit search for TRAPPIST-1 data in Figure 8. Left: generated BLS spectra (gray). Each subsequent spectrum is generated after dividing out the modeled limb-darkened transit signature identified based on the highest peak in the previous BLS spectrum. Peach-colored regions denote the highest peaks identified in each spectrum, with the exact period value quoted in the top left. The first two identified periods (1.5108 and 2.4224 days) correspond to known planets TRAPPIST-1 b and c. Right: limb-darkened transit models fitted at the orbital periods of each identified top BLS peak. The blue points represent phase-folded data in 10 minute bins. The light curves are zoomed in close to the midpoints of the phase-folded transits. Near the top left, the S/N values of a best-fit box-shaped model (from BLS) and a subsequently fitted limb-darkened model (solid black line) are quoted.
Other Images in This Article
Copyright and Terms & Conditions
© 2026. The Author(s). Published by the American Astronomical Society.

