

Image Details
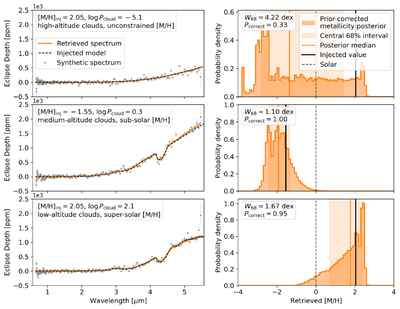
Caption: Figure 8.
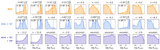
Three representative cases from our synthetic emission retrieval experiment. The left panels show the synthetic emission spectrum (gray points), the injected forward model (black dashed line), and the retrieved spectrum (orange line and shaded 1σ region). The right panels show the prior-corrected metallicity posterior (orange histogram), with the injected value (black solid line), posterior median (orange solid line), central 68% credible interval (orange shaded region), and solar metallicity (black dashed line) indicated. The metrics W68 and Pcorrect are annotated in each panel. High-altitude clouds (top row) yield broad, uninformative metallicity posteriors, while deeper cloud decks (middle and bottom rows) yield well-constrained metallicity estimates.
Other Images in This Article
Show More
Copyright and Terms & Conditions
© 2026. The Author(s). Published by the American Astronomical Society.

