

Image Details
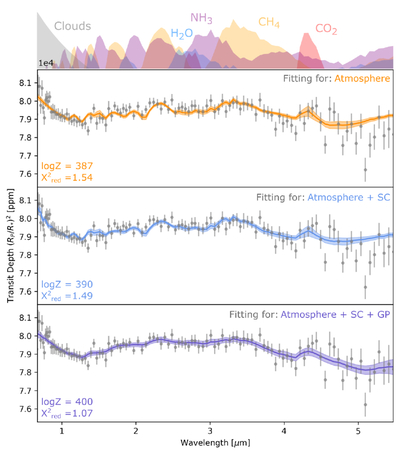
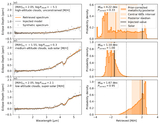
Caption: Figure 3.
Retrieved spectra from each retrieval. The solid lines represent the median spectrum, and the shaded regions show the 1σ bounds. The first panel shows the retrieval only fitting for the atmospheric model, the second shows the retrieval fitting for the atmospheric model and the SC model, and the third shows the retrieval fitting for the atmospheric model, the SC model, and a GP. The top region shows the spectral contribution plots corresponding to the first retrieval only fitting for the atmospheric model.
Other Images in This Article
Show More
Copyright and Terms & Conditions
© 2026. The Author(s). Published by the American Astronomical Society.

Copyright ©
2026 Astronomy Image Explorer. All Rights Reserved.
