

Image Details
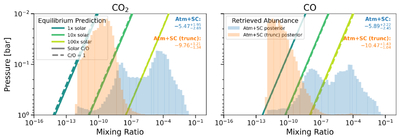
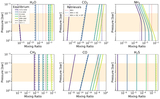
Caption: Figure 7.
Comparison between the atmosphere + SC abundance posteriors and VULCAN chemical equilibrium predictions for CO2 and CO. The blue histograms show the full-spectrum atmosphere + SC posterior distributions, while the orange histograms show the truncated atmosphere + SC posterior distributions (excluding data beyond 4.7 μm). The black solid and dashed vertical lines mark the posterior median and 1σ bounds, respectively. Colored curves show VULCAN equilibrium abundance profiles for 1×, 10×, and 100 × solar metallicity, with solid lines indicating solar C/O (0.55) and dashed lines indicating supersolar C/O (1). Lower-metallicity models fall below the plotted abundance range. The pressure axis is restricted to the approximate region probed, estimated from pressure contribution functions. The full-spectrum atmosphere + SC retrieval yields CO2 and CO abundances above the low-metallicity equilibrium expectations, suggesting disequilibrium chemistry would be required. In contrast, the truncated atmosphere + SC retrieval yields lower abundances more consistent with equilibrium predictions, highlighting that conclusions about chemical disequilibrium are sensitive to the wavelength range included in the retrieval.
Other Images in This Article
Show More
Copyright and Terms & Conditions
© 2026. The Author(s). Published by the American Astronomical Society.

