

Image Details
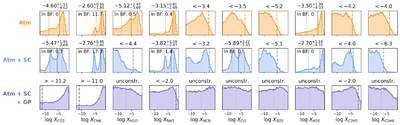
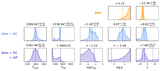
Caption: Figure 4.
Retrieved trace abundances for all three retrievals. Each panel shows the posterior distribution of ﹩\mathrm{log}{X}_{i}﹩ for one molecular species. Numerical labels above each panel summarize the abundance constraint: for molecules with two-sided bounded posteriors, we quote the median and 1σ bounds; for molecules with only one bound, we quote either the 5th-percentile lower limit or the 95th-percentile upper limit; and for posteriors that reach both prior edges, we label the abundance as unconstrained. For molecules with two-sided bounds, we include the Bayes factor (BF).
Other Images in This Article
Show More
Copyright and Terms & Conditions
© 2026. The Author(s). Published by the American Astronomical Society.

Copyright ©
2026 Astronomy Image Explorer. All Rights Reserved.
