

Image Details
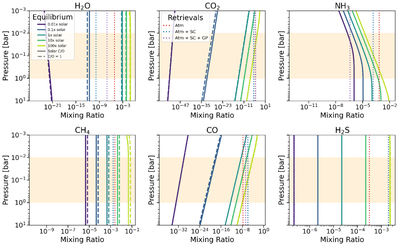
Caption: Figure 10.
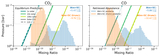
Chemical equilibrium abundance profiles computed with VULCAN for TOI-3235 b across metallicities from 0.01× to 100 × solar. Solid colored curves show models with solar C/O (0.55), while dashed colored curves show models with supersolar C/O (1). The shaded orange region marks the approximate pressure range probed by the transmission spectrum, 10−2–10 bar, estimated from pressure contribution functions. Solid colored curves show the equilibrium predictions, while dashed vertical lines show the median retrieved abundances from the atmosphere-only, atmosphere + SC, and atmosphere + SC + GP retrievals. The six species shown are those whose equilibrium abundances overlap our retrieval prior range of 10−12–10−1 within this pressure region.
Other Images in This Article
Show More
Copyright and Terms & Conditions
© 2026. The Author(s). Published by the American Astronomical Society.

