

Image Details
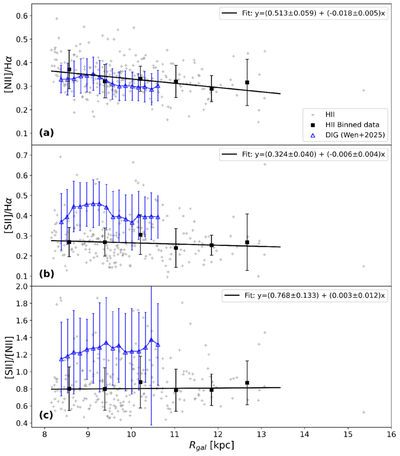
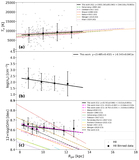
Caption: Figure 9.
Radial gradients of line ratios as functions of Rgal. The panels show (a) [N II]/Hα, (b) [S II]/Hα, and (c) [S II]/[N II]. Gray plus signs denote H II regions, and black squares represent the median values of binned H II regions, with scatter shown as error bars. Black lines correspond to linear fits to the median values, using errors as weights. Blue triangles and connecting lines represent the DIG sample from S. Wen et al. (2025).
Other Images in This Article
Show More
Copyright and Terms & Conditions
© 2026. The Author(s). Published by the American Astronomical Society.

Copyright ©
2026 Astronomy Image Explorer. All Rights Reserved.
