

Image Details
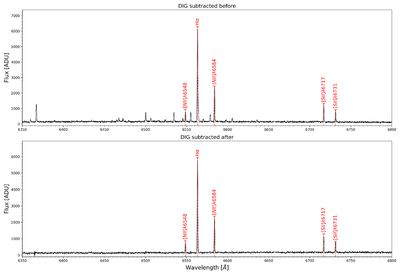
Caption: Figure 2.
Example of the sky/DIG subtraction procedure. The observed spectrum before sky/DIG subtraction is shown in the top panel, while the sky/DIG-subtracted spectrum is shown in the bottom panel. The main emission lines are marked with red dashed vertical lines. The flux is given in units of ADU.
Other Images in This Article
Show More
Copyright and Terms & Conditions
© 2026. The Author(s). Published by the American Astronomical Society.

Copyright ©
2026 Astronomy Image Explorer. All Rights Reserved.
