

Image Details
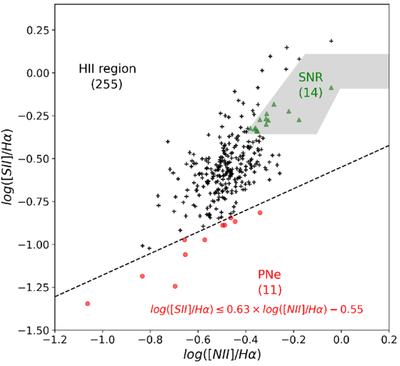
Caption: Figure 4.
SMB diagnostic diagram. The black dashed line is the criterion to separate H II regions and PNe, whose mathematical expression is shown in the lower right corner. The gray shaded area belongs to SNRs. H II regions, PNe, and SNRs are denoted by black plus signs, red circles, and green triangles, respectively.
Other Images in This Article
Show More
Copyright and Terms & Conditions
© 2026. The Author(s). Published by the American Astronomical Society.

Copyright ©
2026 Astronomy Image Explorer. All Rights Reserved.
