

Image Details
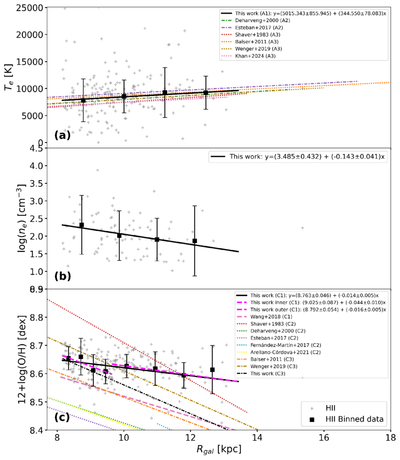
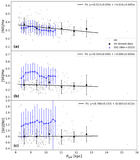
Caption: Figure 10.
Radial gradients of physical properties as functions of Rgal. The panels from top to bottom are Te, ne, and oxygen abundance (in units of 12+log(O/H)), respectively. Gray plus signs denote H II regions, and black squares represent the median values of binned H II regions, with scatter shown as error bars. The black solid lines are the global fitting results for median values. The other color lines are the gradients from the literature, with method labels: in panel (a) for Te, (A1) optical line width, (A2) optical auroral line ratio, and (A3) radio continuum flux and RRL; in panel (c) for 12 + log(O/H), (C1) N2Hα method, (C2) direct method, and (C3) empirical relationship between 12+log(O/H) and Te. In panel (c), the magenta dashed lines are the segment fitting results.
Other Images in This Article
Show More
Copyright and Terms & Conditions
© 2026. The Author(s). Published by the American Astronomical Society.

