

Image Details
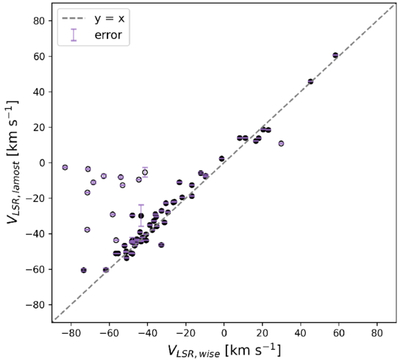
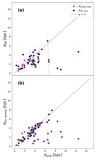
Caption: Figure 7.
Comparison of VLSR,lamost with VLSR,wise. VLSR,lamost values are obtained from our LAMOST spectra in Section 3.2. VLSR,wise values are provided by H II cat_V2.3. Error bars are shown in purple. Open circles represent the outliers from panel (b) of Figure 6. A gray dashed line y = x is included for reference.
Other Images in This Article
Show More
Copyright and Terms & Conditions
© 2026. The Author(s). Published by the American Astronomical Society.

Copyright ©
2026 Astronomy Image Explorer. All Rights Reserved.
