

Image Details
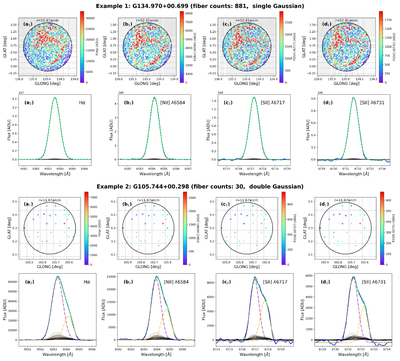
Caption: Figure 3.
Fiber distributions and spectral processes for two example H II regions. Example 1: panels (a1)–(d1) show the spatial distributions of fibers in the radius range, overlaid with 3﹩^{\prime} ﹩ × 3﹩^{\prime} ﹩ grids. The color bars indicate the flux values of Hα, [N II] λ6584, [S II] λ6717, and [S II] λ6731, respectively. Panels (a2)–(d2) show the processes of stacking and Gaussian fitting. Each gray line represents one individual spectrum, and the blue lines are the stacked spectra. The green dashed lines are the Gaussian fitting results. Example 2: same as Example 1, and the additional purple and orange dashed lines represent the two Gaussian components.
Other Images in This Article
Show More
Copyright and Terms & Conditions
© 2026. The Author(s). Published by the American Astronomical Society.

