

Image Details
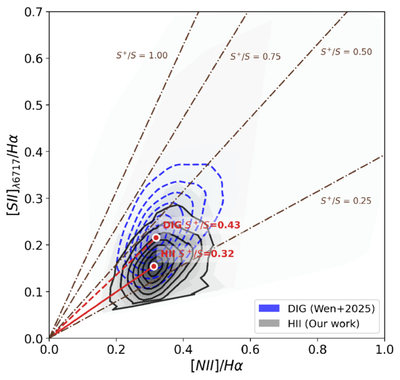
Caption: Figure 13.
Distribution of H II regions and DIG on the [N II]/Hα vs. [S II] λ6717/Hα diagram. H II regions are shown with gray contours. Blue contours represent DIG from S. Wen et al. (2025). The brown dashed–dotted lines are the line emissivity models from G. J. Madsen et al. (2006), corresponding to S+/S = 0.25, 0.50, 0.75, and 1.00 from the lowest to the highest slope. The red solid and dashed lines indicate the density peaks of the H II regions and DIG contour distributions, respectively, with corresponding S+/S values of 0.32 and 0.43.
Other Images in This Article
Show More
Copyright and Terms & Conditions
© 2026. The Author(s). Published by the American Astronomical Society.

Copyright ©
2026 Astronomy Image Explorer. All Rights Reserved.
