

Image Details
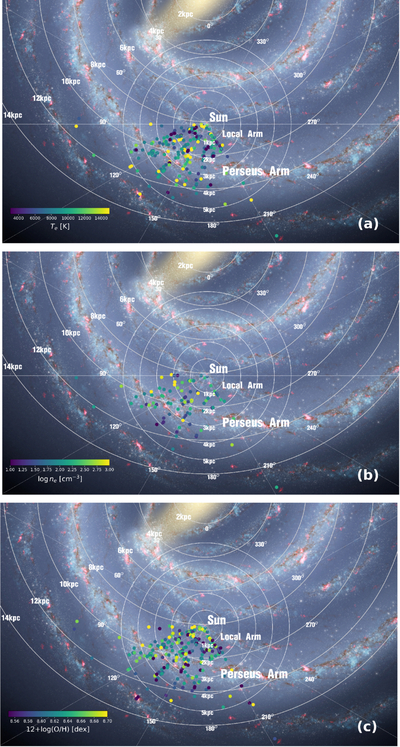
Caption: Figure 11.
2D distributions from face-on view of the Milky Way. The colors of points indicate the values of Te, ne, and ﹩12+\mathrm{log}({\rm{O}}/{\rm{H}})﹩. The color bars on the right show the range of each parameter. In panels (a)−(c), the number of H II regions is 227, 94, and 246, respectively.
Other Images in This Article
Show More
Copyright and Terms & Conditions
© 2026. The Author(s). Published by the American Astronomical Society.

Copyright ©
2026 Astronomy Image Explorer. All Rights Reserved.
