

Image Details
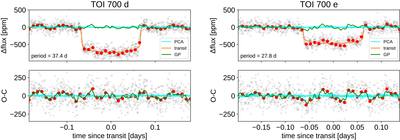
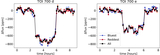
Caption: Figure 4.
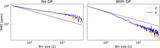
Our NIRISS/SOSS transits of TOI 700 d and e. Unbinned data are in gray, binned data are in red, the best-fit transit model is in orange, and the systematics model is in blue. The lower panels show the residuals after subtracting the transit model. Our PCA-determined instrumental systemics model is unable to explain the correlated noise in the residuals; we quantify this excess correlated noise by fitting a Gaussian process (GP), shown in green. We use the same GP hyperparameters for the two transits, with a best-fitting timescale of 16 ± 4 minutes and amplitude of 46 ± 4 ppm. Without a correction, the rms of the residuals in 10 minute bins is 39 ppm for d and 44 ppm for e, or 12 ppm for both if we apply the GP correction.
Other Images in This Article
Copyright and Terms & Conditions
© 2026. The Author(s). Published by the American Astronomical Society.

