

Image Details
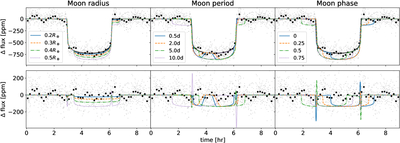
Caption: Figure 8.
We use the pandora package to illustrate the effects of varying moon parameters on the light curve. The black line in the upper panels shows a fiducial planet-only model that matches our observations of TOI 700 d, which we also plot to contextualize the amplitude of potential moon-induced changes. The colored lines illustrate a moon+planet model: from left to right, we vary the moon’s radius, period, and phase. When not varying a given parameter, we adopt 0.5R⊕ in radius, 7 days in period, and 0.25 in phase. The lower panels show the residuals after subtracting the fiducial model. The presence of a moon can influence the transit depth and time of transit (effects that we cannot easily distinguish from the planet-only model in a single transit), as well as the transit shape (effects that are more readily distinguishable in a single epoch of observations).
Other Images in This Article
Copyright and Terms & Conditions
© 2026. The Author(s). Published by the American Astronomical Society.

