

Image Details
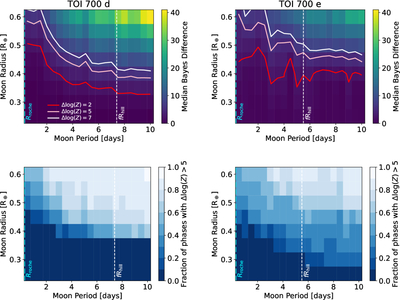
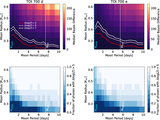
Caption: Figure 10.
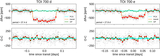
The left plots show the results of our injection and recovery test into our JWST observation of TOI 700 d, and the right plots are for e. The Roche limit and f times the Hill radius are noted, where f = 0.4895 (R. C. Domingos et al. 2006); these lines bound the region in which a prograde satellite is expected to be dynamically stable. In the upper panels, the heat map provides the Bayes difference between the planet-only and planet+moon models, taking the median of the results across the 100 injections. The red solid line indicates the ﹩{\rm{\Delta }}\mathrm{log}(Z)=2﹩ contour, the pink indicates ﹩{\rm{\Delta }}\mathrm{log}(Z)=5﹩, and the white indicates ﹩{\rm{\Delta }}\mathrm{log}(Z)=7﹩ (corresponding to 7.4:1, 148:1, and 1097:1 odds in favor of the planet+moon model, respectively). In the lower panels, we plot the fraction of the 100 phases that yield ﹩{\rm{\Delta }}\mathrm{log}(Z)\gt 5﹩. These plots illustrate that there are certain phases at which it is particularly challenging to differentiate a moon from a larger planet-only solution given the noise present in our data. It is also challenging to detect a moon whose period is less than 2 days, as the shape changes at ingress and egress become more subtle than the noise in our light curves.
Other Images in This Article
Copyright and Terms & Conditions
© 2026. The Author(s). Published by the American Astronomical Society.

