

Image Details
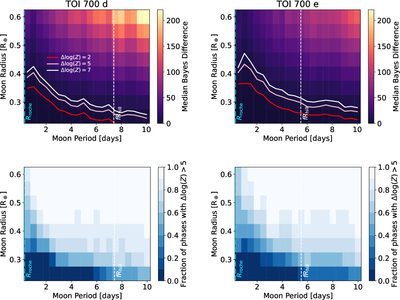
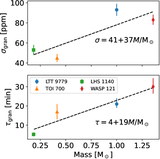
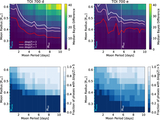
Caption: Figure 11.
The same as Figure 10, but for the idealized case where we have removed the correlated noise using the GP fit from Figure 4 before conducting our injection and recovery test. These figures thus represent the sensitivity to moons that is possible with the current data if future analyses are able to mitigate this noise source and recover the photon-noise limit.
Other Images in This Article
Copyright and Terms & Conditions
© 2026. The Author(s). Published by the American Astronomical Society.

Copyright ©
2026 Astronomy Image Explorer. All Rights Reserved.
