

Image Details
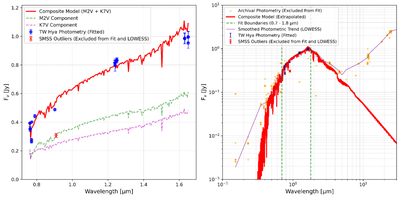
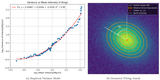
Caption: Figure 14.
Determination of the TW Hya stellar reference spectrum. Left: a two-component composite spectrum (red solid line) fitted to the selected near-infrared photometry of TW Hya (blue points). The individual components of the model—an M2V component (green dashed line) and a K7V component (magenta dashed line)—are shown separately. Two anomalously low SMSS measurements are marked with red crosses and were excluded from both the composite-model fit and the LOWESS smoothing. Right: the full observed SED of TW Hya. Archival photometry not used in the stellar fit is shown as orange points, while the fitted photometry and excluded SMSS measurements are shown as blue points and red crosses, respectively. The vertical green dashed lines indicate the 0.7–1.8 μm fitting interval. The best-fit composite spectrum is extrapolated over the full wavelength range (red solid line), and the purple line shows the LOWESS-smoothed trend derived from the archival photometry after excluding the two SMSS outliers. The ultraviolet and optical excess is associated primarily with accretion, whereas the infrared excess arises from thermal emission and scattered light from circumstellar material.
Other Images in This Article
Show More
Copyright and Terms & Conditions
© 2026. The Author(s). Published by the American Astronomical Society.

