

Image Details
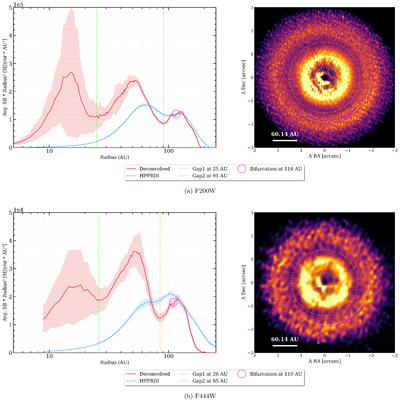
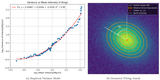
Caption: Figure 8.
Radial surface brightness profiles and corresponding r2-scaled images of the TW Hya disk in the (a) F200W and (b) F444W filters. Left panels: the y-axis shows the average surface brightness multiplied by the radius squared (r2) to compensate for the geometric fall-off of starlight. The solid red line shows the profile from the deconvolved image, with the shaded region indicating the 1σ standard error of the mean (SEM)—corrected for the effective beam size to account for correlated noise—across the radial bins. The dashed blue line is the profile from the HPFRDI-processed image. Vertical dotted lines highlight radial gaps at 25 au (green) and 91 au (orange) in F200W, and 26 au (green) and 85 au (orange) in F444W, while the open magenta circles mark the bifurcation structure at 116 au in F200W and 110 au in F444W. Right panels: the 2D images of the disk, similarly scaled by r2 and normalized to reveal faint outer-disk structures. Dotted rings spatially trace the locations of the Gap 1 and Gap 2 structures. A dashed white curve with a magenta arrow traces the morphology of the spiral/bifurcation feature extending outward.
Other Images in This Article
Show More
Copyright and Terms & Conditions
© 2026. The Author(s). Published by the American Astronomical Society.

