

Image Details
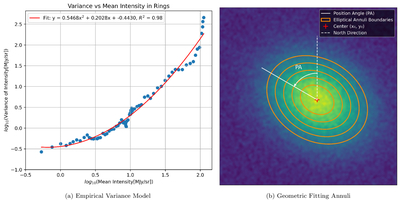
Caption: Figure 4.
Methodology for the geometric fitting of the disk. Panel (a) shows the diagnostic plot establishing the empirical variance model. The relationship between ﹩{{\rm{log}}}_{10}﹩(Variance) and ﹩{{\rm{log}}}_{10}﹩(Mean Intensity) is well described by a second-order polynomial (red line, R2 = 0.98), which accounts for the nonlinear combination of statistical noise and unresolved astrophysical structure. Panel (b) visualizes the annuli used in the fitting process (orange ellipses) overlaid on the simulated inclined disk data. The Markov Chain Monte Carlo (MCMC) algorithm seeks the geometric parameters—center (x0, y0), inclination, and PA—that minimize the observed brightness variance within these elliptical annuli, weighted by the model established in panel (a).
Other Images in This Article
Show More
Copyright and Terms & Conditions
© 2026. The Author(s). Published by the American Astronomical Society.

