

Image Details
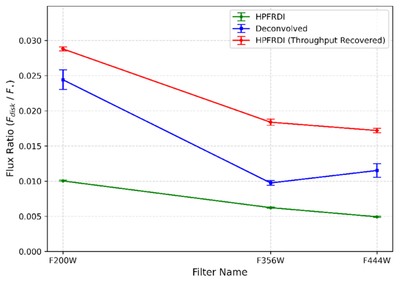
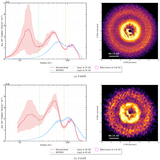
Caption: Figure 2.
Relative photometry of the TW Hya disk from our JWST/NIRCam observations showing the ratio of the disk flux compared to that of the stellar photosphere. The green line represents the flux from the HPFRDI-processed images, which is a lower limit due to signal attenuation from the stellar-light subtraction process and the coronagraphic mask. The red line shows the result after applying a theoretical throughput recovery to the HPFRDI data. The blue line shows the flux from the final deconvolved images, which provides our best estimate of the disk’s brightness.
Other Images in This Article
Show More
Copyright and Terms & Conditions
© 2026. The Author(s). Published by the American Astronomical Society.

Copyright ©
2026 Astronomy Image Explorer. All Rights Reserved.
