

Image Details
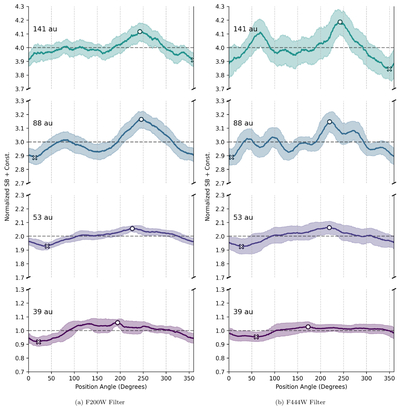
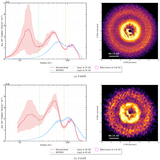
Caption: Figure 9.
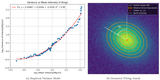
Azimuthal surface brightness profiles from the JWST/NIRCam observations, derived from the HPFRDI images. This approach was chosen to analyze the on-sky brightness distribution before deconvolution, avoiding potential artifacts that could affect the measurement of azimuthal structures. Panel (a) shows the F200W data, and panel (b) shows the F444W data. Each profile is calculated using a pixel-by-pixel sliding window (3 pixels radially by 15 pixels azimuthally) to ensure the extraction area approximates the instrumental beam size. The profiles are normalized by their respective means and offset vertically for clarity. The solid line represents the normalized mean, the shaded region indicates the SEM corrected for the effective sample size (Neff), and the measured brightness minima (crosses) and maxima (circles) are marked. The systematic radial shift in the positions of these features across both filters is consistent with a shadow being projected onto a warped outer disk.
Other Images in This Article
Show More
Copyright and Terms & Conditions
© 2026. The Author(s). Published by the American Astronomical Society.

