

Image Details
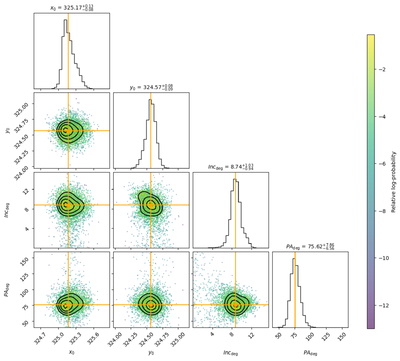
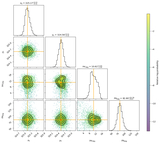
Caption: Figure 5.
MCMC posterior distributions from the fit to the whole disk (0﹩\mathop{.}\limits^{{\unicode{x02033}}}﹩675–2﹩\mathop{.}\limits^{{\unicode{x02033}}}﹩98). This fit provides the averaged geometry for the system. Each panel shows the 1D and 2D projections of the posterior probability distributions for the geometric parameters. The histograms show the marginalized distribution for each parameter, with the median value and 1σ uncertainties quoted; the solid orange lines indicate the median values.
Other Images in This Article
Show More
Copyright and Terms & Conditions
© 2026. The Author(s). Published by the American Astronomical Society.

Copyright ©
2026 Astronomy Image Explorer. All Rights Reserved.
