

Image Details
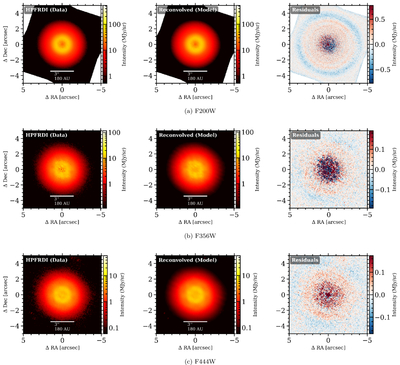
Caption: Figure 13.
Quality assessment for the deconvolution process. Each row presents the results for a specific filter: (a) F200W, (b) F356W, and (c) F444W. In each row, the left panel shows the input HPFRDI data; the middle panel shows the deconvolved source distribution forward-modeled (reconvolved) with the instrumental PSFs; and the right panel shows the residuals (Data − Model). The residuals show a pattern that correlates with the disk’s surface brightness, as expected for intensity-dependent noise and deconvolution residuals, but they reveal no significant unmodeled astrophysical structures.
Other Images in This Article
Show More
Copyright and Terms & Conditions
© 2026. The Author(s). Published by the American Astronomical Society.

Copyright ©
2026 Astronomy Image Explorer. All Rights Reserved.
