

Image Details
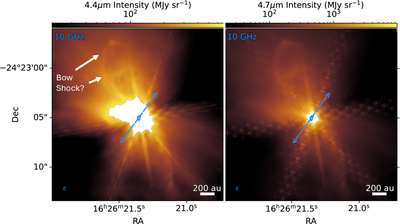
Caption: Figure D1.
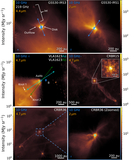
4.4 μm (left) and 4.7 μm (right) color maps focused on GSS30-IRS1. We have applied a lognormal stretch with a minimum of 20 MJy sr−1 in order to accentuate potential structures in the image. We show VLA 10 GHz contours in blue, where contours are 3σ, 5σ, 10σ, 20σ, and 100σ, with σ ∼ 4 μJy. Beam sizes are shown as open ellipses in the bottom left and a 200 au scale bar is shown in the bottom right of each panel. Finally, we indicate the PA and its inverse of the 10 GHz continuum for GSS30-IRS1 with blue dashed arrows.
Other Images in This Article
Show More
Copyright and Terms & Conditions
© 2026. The Author(s). Published by the American Astronomical Society.

Copyright ©
2026 Astronomy Image Explorer. All Rights Reserved.
