

Image Details
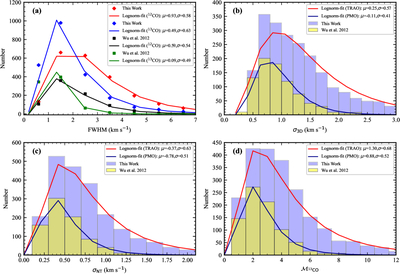
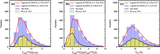
Caption: Figure 8.
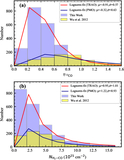
Distributions of kinematic parameters derived from the 12CO and 13CO observations. (a) FWHM of the 12CO and 13CO lines. (b) Three-dimensional velocity dispersion (σ3D). (c) Nonthermal velocity dispersion (σNT). (d) Mach number, ﹩{{ \mathcal M }}_{{}^{13}{\rm{CO}}}={\sigma }_{{\rm{NT}}}/{c}_{s}﹩ histograms show the TRAO data (this work) and the PMO data from Y. Wu et al. (2012). Solid curves represent lognormal fits with the best-fit parameters (μ, σ) indicated.
Other Images in This Article
Show More
Copyright and Terms & Conditions
© 2026. The Author(s). Published by the American Astronomical Society.

Copyright ©
2026 Astronomy Image Explorer. All Rights Reserved.
