

Image Details
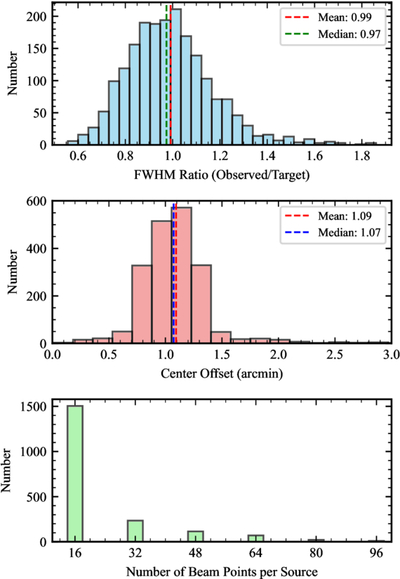
Caption: Figure 3.
Statistics of the TRAO sampled footprints relative to the PGCC catalog footprints. The top panel presents the ratio of the effective FWHMs of the fitted sampling ellipse to the PGCC catalog FWHMs, and the middle panel presents the offset between the fitted sampling center and the catalog center. The dashed lines mark the mean and median values. The bottom panel presents the distribution of sampled beam positions per source; 16 positions correspond to one nominal SEQUOIA-TRAO pointing, whereas larger numbers indicate additional offset pointings.
Other Images in This Article
Show More
Copyright and Terms & Conditions
© 2026. The Author(s). Published by the American Astronomical Society.

Copyright ©
2026 Astronomy Image Explorer. All Rights Reserved.
