

Image Details
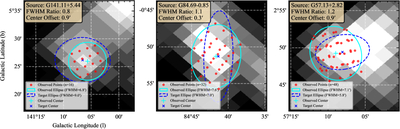
Caption: Figure 2.
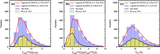
Representative TRAO 13CO sampled footprints overlaid on the Planck 857 GHz continuum maps. The panels show, from left to right, PGCC G141.11+5.44, G84.69−0.85, and G57.13+2.82, illustrating different numbers of sampled beam positions. Red points mark the TRAO beam positions. The cyan ellipse shows the effective sampling footprint fitted to these positions, and the blue dashed ellipse denotes the corresponding PGCC catalog ellipse. The cyan and blue crosses indicate the fitted sampling center and the catalog center, respectively. The fitted-to-catalog FWHM ratio and center offset are given in each panel.
Other Images in This Article
Show More
Copyright and Terms & Conditions
© 2026. The Author(s). Published by the American Astronomical Society.

