

Image Details
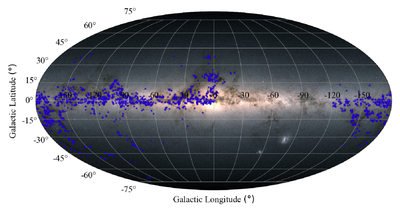
Caption: Figure 1.
Spatial distribution of the PGCC catalog (N = 2008 sources, shown as blue points). The background displays the Gaia all-sky map combining G, GBP, and GRP bands. The visualization methodology was implemented using a Python code adapted from L. Lagman (2022).
Other Images in This Article
Show More
Copyright and Terms & Conditions
© 2026. The Author(s). Published by the American Astronomical Society.

Copyright ©
2026 Astronomy Image Explorer. All Rights Reserved.
