

Image Details
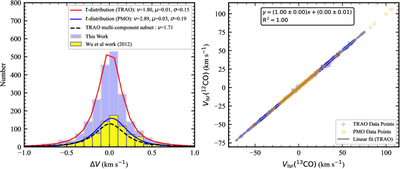
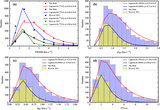
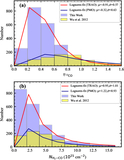
Caption: Figure 5.
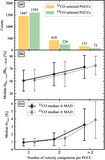
Left panel: distribution of the centroid-velocity difference ΔV. Blue and yellow histograms represent the new TRAO sample and the PMO sample from Y. Wu et al. (2012), respectively. Solid curves show the best-fit Student’s t-distributions for the two full samples, with the corresponding fit parameters indicated. The dashed curve shows the fit for the TRAO subset associated with PGCCs exhibiting multiple detected 13CO velocity components. Right panel: comparison of the 12CO and 13CO centroid velocities for the same matched components. The solid line shows the linear fit to the TRAO data.
Other Images in This Article
Show More
Copyright and Terms & Conditions
© 2026. The Author(s). Published by the American Astronomical Society.

Copyright ©
2026 Astronomy Image Explorer. All Rights Reserved.
