

Image Details
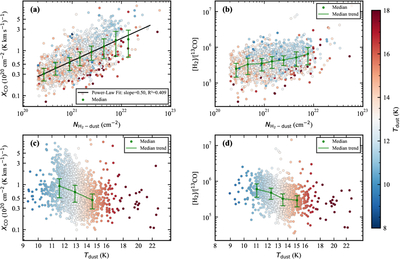
Caption: Figure 13.
Variations of molecular gas parameters with dust-derived H2 column density and dust temperature. Panel (a) shows XCO versus ﹩{N}_{{{\rm{H}}}_{2}-{\rm{dust}}}﹩, panel (b) shows [H2]/[13CO] versus ﹩{N}_{{{\rm{H}}}_{2}-{\rm{dust}}}﹩, panel (c) shows XCO versus Tdust, and panel (d) shows [H2]/[13CO] versus Tdust. The green symbols and connecting lines indicate the binned median trends.
Other Images in This Article
Show More
Copyright and Terms & Conditions
© 2026. The Author(s). Published by the American Astronomical Society.

Copyright ©
2026 Astronomy Image Explorer. All Rights Reserved.
