Image Details
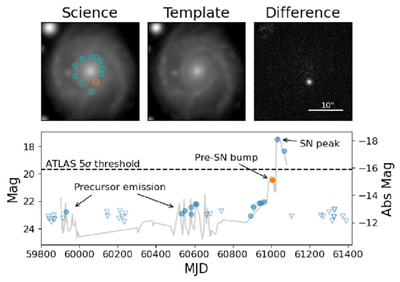
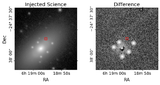
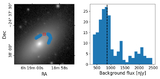
Caption: Figure 8.
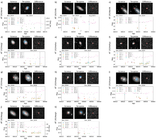
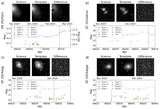
We injected a postage stamp of NGC 6308 and the light curve of SN 2009ip into Rubin DP0 at a distance of 129.74 Mpc to simulate whether we can recover it at this distance using DETECT. The top row shows the science, template, and difference images of the epoch corresponding to the pre-SN bump phase of SN 2009ip. The science image additionally shows the location of where SN 2009ip was injected (orange circle) and the injection locations identified by DETECT (cyan circles). The difference image shows a scale bar of 10″. The bottom row shows the rescaled full light curve of SN 2009ip (gray line), as well as the Rubin DP0 epochs in which it was injected. Full circles denote epochs where the reported flux exceeded the 80% detection threshold (i.e., these epochs are detected), whereas downward triangles represent nondetections, placed at the 80% detection threshold. The dashed horizontal line denotes the 5σ detection threshold of ATLAS at 19.7 mag (J. L. Tonry et al. 2018).
Other Images in This Article
Show More
Copyright and Terms & Conditions
© 2026. The Author(s). Published by the American Astronomical Society.