Image Details
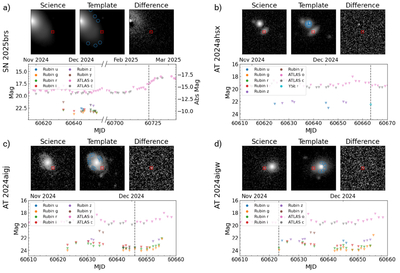
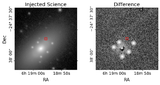
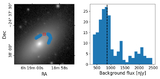
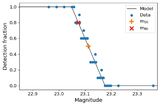
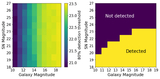
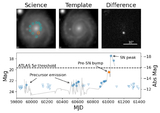
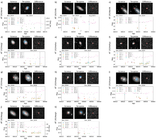
Caption: Figure 10.
This figure shows the results from DETECT of targets where we did not find any significant detections. Within each panel, the top row shows the science image, template image, and difference image of the highest SNR epoch of this target. Each image cutout is 20 by 20″. The red cross indicates the location of the target of interest. The injection locations are shown in each template image with blue circles. The bottom row of each panel shows the light curve of that target. We include data from Rubin DP1 (NSF-DOEVera C. Rubin Observatory 2025a) that was analyzed with DETECT. The downward triangles represent nondetections, placed at the 80% detection threshold. Points outlined with a black line denote epochs where DETECT and the default 5σ threshold disagreed with each other. Note that we only show Rubin DP1 epochs when we were able to run DETECT. This was not possible for every band and/or epoch due to incomplete templates, the target being too close to the edge of the exposure, or the inability to find suitable injection locations (see Section 5.5). We also show the ATLAS light curve for more context (J. L. Tonry et al. 2018). The vertical dashed line is placed at the discovery date of the target.
Other Images in This Article
Show More
Copyright and Terms & Conditions
© 2026. The Author(s). Published by the American Astronomical Society.