Image Details
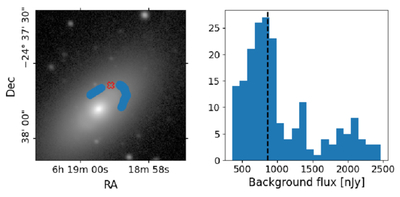
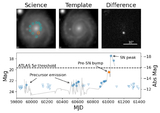
Caption: Figure 5.
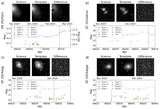
The blue region in the left panel shows the locations in the host galaxy where the flux in the template is within 5% of the flux in the template at the SN location. The red cross shows the location of SN 2025brs. The right panel shows the distribution of fluxes that are found by performing forced photometry on the difference image at all of these locations. The dashed vertical line indicates the median of this distribution, which is equal to 863 ± 353 nJy.
Other Images in This Article
Show More
Copyright and Terms & Conditions
© 2026. The Author(s). Published by the American Astronomical Society.
Copyright ©
2026 Astronomy Image Explorer. All Rights Reserved.